EasePop
  • Home
  • Features
  • Documentation
  • FAQ
  • Showcase
  • Pricing
  • Contact
Log inGet Started
EasePop Knowledge Base
EasePop Documentation
Quick Start Guide
Popup Editor
Analytics
Compliance & Privacy
FAQ
User Submissions
Plan Usage Limits
API Reference
Getting Started

Analytics

Use analytics tools to supercharge your popups.

Overview

Analytics dashboard preview

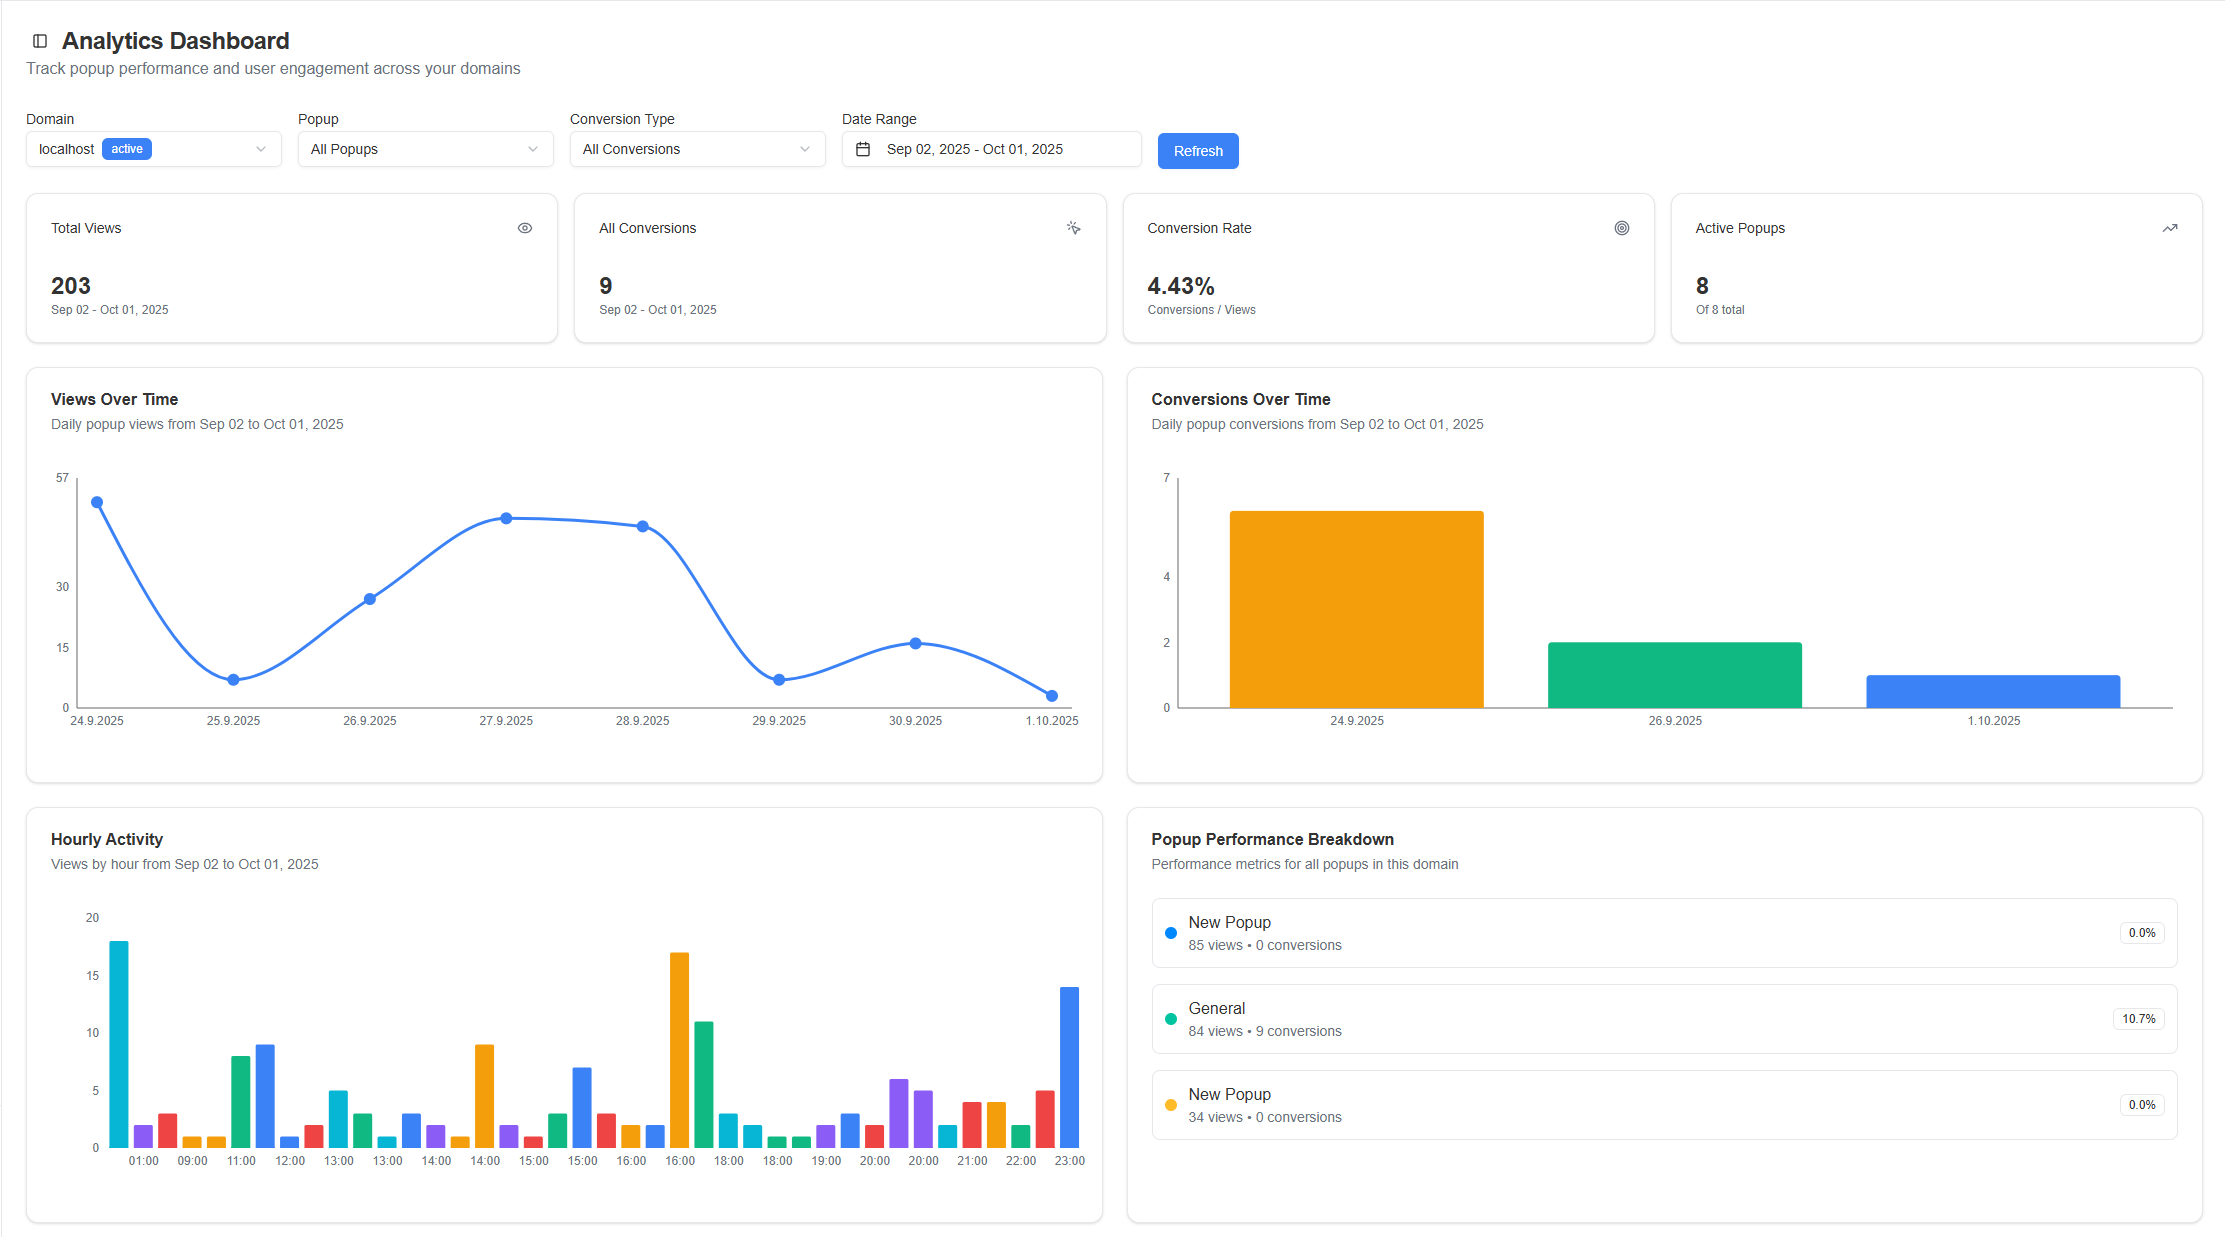
The analytics dashboard helps you track popup performance across your domains. Access it at Analytics in your dashboard.

Filters

  • Domain: Choose which connected domain to analyze.
  • Popup: Focus on a single popup or view all popups.
  • Conversion Type: Filter by submission, click, or all conversions.
  • Date Range: Select a time window to analyze; press Refresh to apply.

What you can see

  • Total Views: Number of popup impressions for the period.
  • All Conversions: Total conversions that matched your selected type.
  • Conversion Rate: Conversions divided by views.
  • Active Popups: How many popups were active on the selected domain.
  • Views Over Time: Daily trend of impressions.
  • Conversions Over Time: Daily trend of conversions.
  • Hourly Activity: Impressions by hour to spot peak times.
  • Popup Performance Breakdown: Compares views and conversions per popup.
  • Clicked URLs: Destinations users clicked from your popups.

Popup Editor

Master the visual popup editor and design tools.

Compliance & Privacy

How to stay compliant with GDPR and privacy regulations while using EasePop.

On this page

OverviewFiltersWhat you can see